The Lab: Installing and Configuring CloudWatch Agent walks you through the process of setting up the CloudWatch Agent on an EC2 instance to monitor custom system-level metrics. Here’s a summarized walkthrough of the key steps:
Lab Prerequisites
- Familiarity with EC2 instance creation and management.
- Optional: Review related labs (e.g., setting up a web server on EC2).
Lab Objectives
Install and configure the CloudWatch Agent to:
- Monitor CPU, memory, disk, and network usage.
- Send custom metrics to Amazon CloudWatch.
Objectives
In this lab, we’ll set up an EC2 instance to demonstrate how to install and configure CloudWatch Agent.
Connecting to your EC2 Instance via EC2 Instance Connect
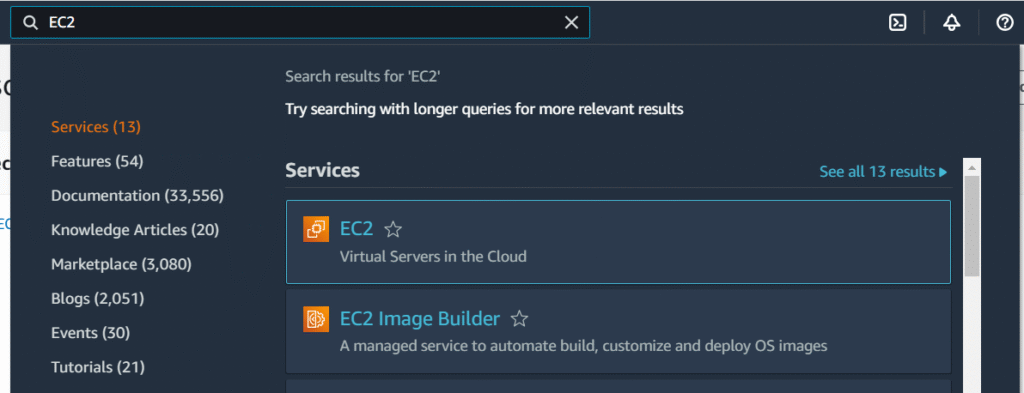
- Search “ec2” in the AWS Management Console search bar and Click EC2 on the search results.
- Launch EC2 instance with the following configurations.
Name: CWAgent
AMI: Ubuntu
Instance type: t2.micro
Key pair: If you don’t already have a key pair, please create a new one.
Key pair name: CWAgent-ssh
Key pair type: RSA
Private key file format: pem
Network settings:
Allow SSH traffic from: My IP - Create an IAM Role:
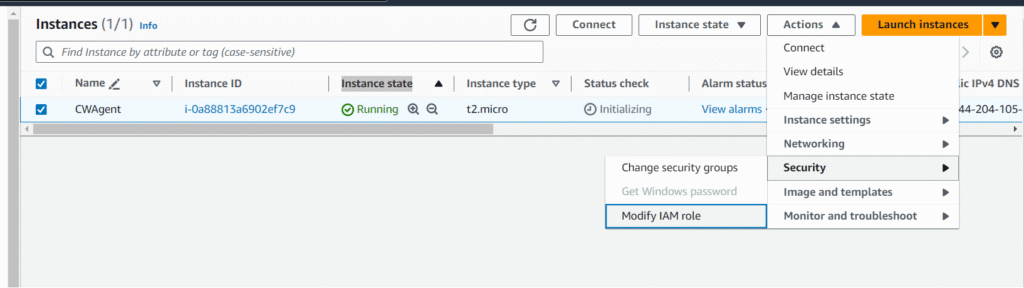
Before CloudWatch will work with an EC2instance, it must have an IAM role. For this lab, we will be using the provided IAM role. - Before you proceed, make sure that the Instance state is Running
- Attach the IAM Role to the EC2 instance: Navigate to the EC2console and select your instance. Click on Actions -> Security ->Modify IAM role.
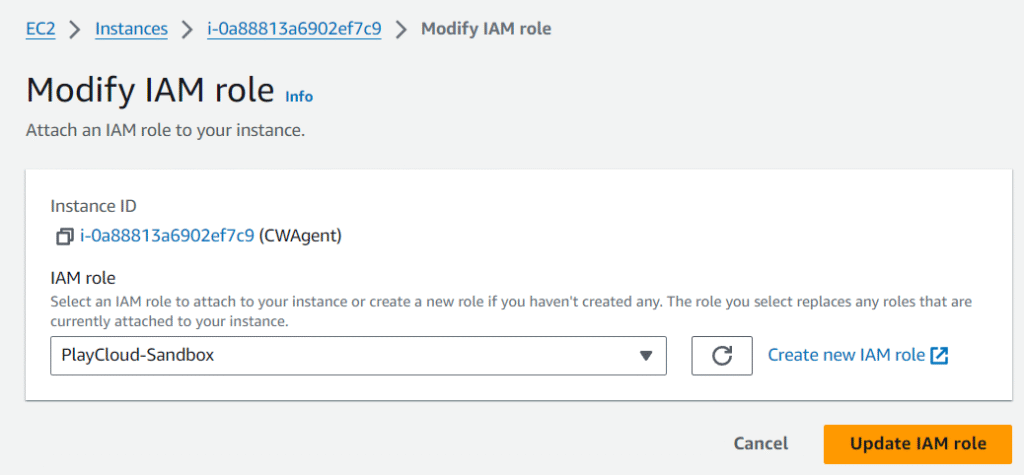
7.Click Update IAM role.
Installing the CloudWatch Agent
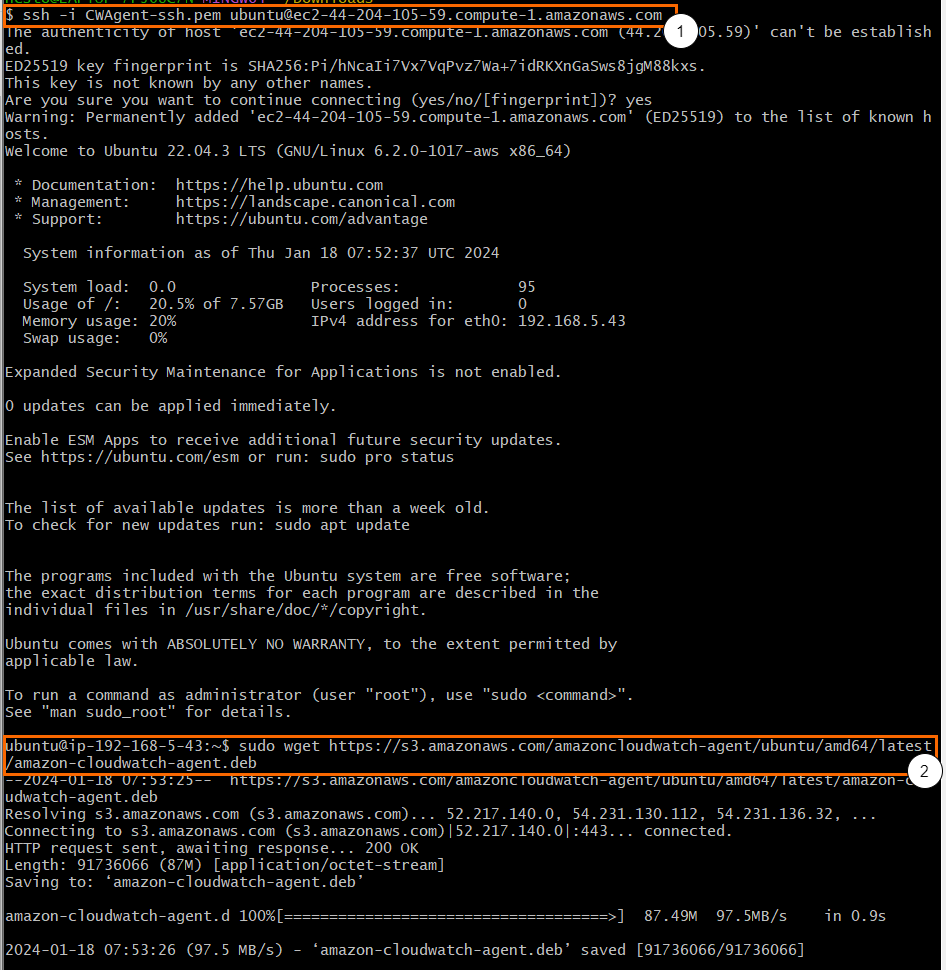
- Download the CloudWatch Agent Package: SSH into your instance and run the command below:
sudo wget https://s3.amazonaws.com/amazoncloudwatchagent/
ubuntu/amd64/latest/amazon-cloudwatch-agent.deb
This command simply downloads the agent from an S3 bucket to the
current directory.
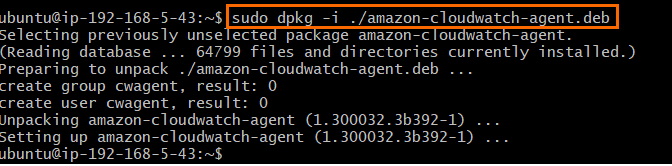
- Install the CloudWatch Agent: Run the command below:
sudo dpkg -i ./amazon-cloudwatch-agent.deb
This command installs the agent using the DEB package manager.
Configuring the CloudWatch agent to send custom
metrics to CloudWatch
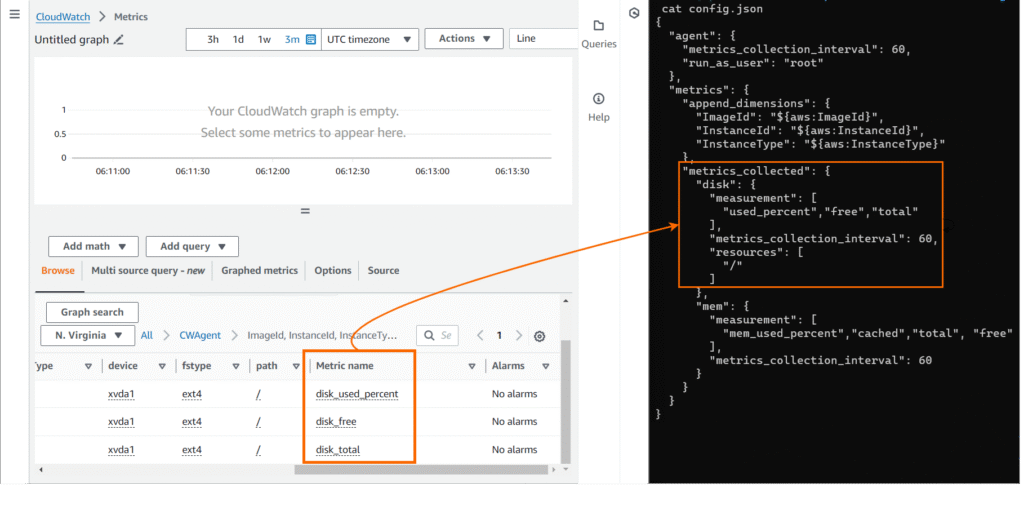
- Edit the agent’s configuration file. Run sudo vi
/opt/aws/amazon-cloudwatch-agent/bin/config.json
Copy-paste the following:
{
    "agent":
         { "metrics_collection_interval": 60,
              "run_as_user": "root" },
             "metrics": {
                      "append_dimensions": {
                             "ImageId": "${aws:ImageId}",
                             "InstanceId": "${aws:InstanceId}",
                             "InstanceType": "${aws:InstanceType}"
                                   },
                   "metrics_collected": {
                       "disk": {
                             "measurement": [
                                "used_percent" ],
                                 "metrics_collection_interval": 60,
                                        "resources": [
                                                      "/"
                                                  ]
                                                 },
                                             "mem": {
                                                 "measurement": [
                                                               "mem_used_percent"
                                                                           ],
                                                                         "metrics_collection_interval": 60
                                                                             }
                                                                   }
                                                         }
                                              }
Enter ESC :wq! to save the file.
2. Stop and Start the CloudWatch Agent:
Stop the CloudWatch Agent using the command line.
sudo /opt/aws/amazon-cloudwatch-agent/bin/amazon-cloudwatch-agent-ctl -m ec2 -a stopStart the CloudWatch agent using the command line.
sudo /opt/aws/amazon-cloudwatch-agent/bin/amazon-cloudwatch-agent-ctl -a fetch-config -m ec2 -s -c file:/opt/aws/amazon-cloudwatch-agent/bin/config.json3. Validate Agent is Active: Start the agent, check the agent logs, and review the console for server log data and metrics. Run the following commands.
sudo /opt/aws/amazon-cloudwatch-agent/bin/amazon-cloudwatch-agent-ctl -m ec2 -a status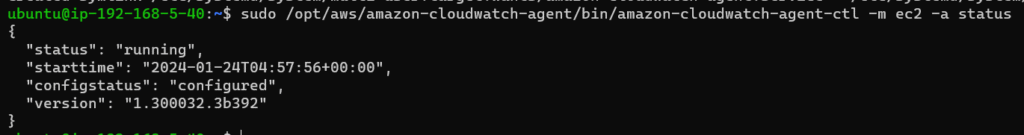
cat /opt/aws/amazon-cloudwatch-agent/logs/configuration-validation.log
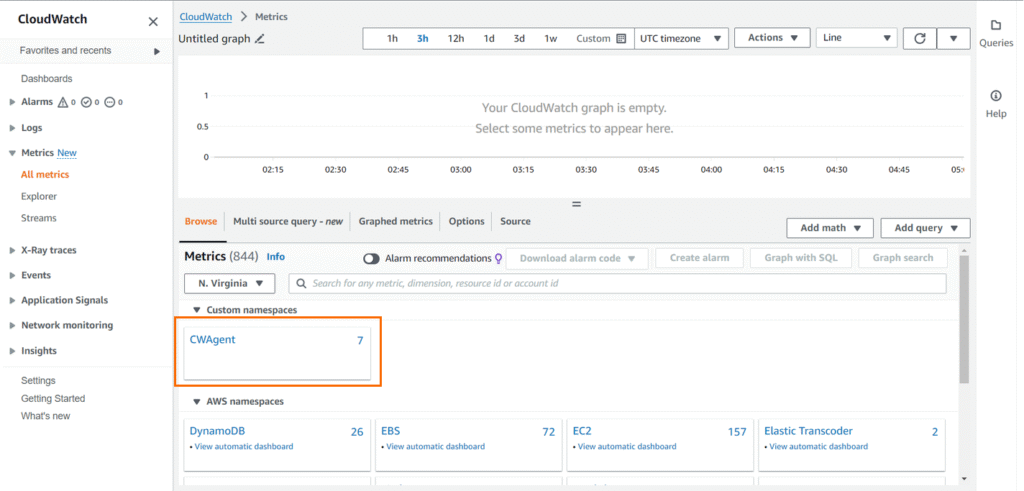
- Confirm if the custom metrics are being sent to CloudWatch.
Go to CloudWatch → Metrics → All Metrics → CWAgent
Now, let’s break down each metric in your configuration:
metrics_collection_interval:
This is the frequency at which the metrics are collected. It’s set to 60 seconds, which means the CloudWatch agent will collect metrics every minute.
run_as_user:
This is the user that the CloudWatch agent runs as. It’s set to “root”, which means the agent has full permissions on the system.
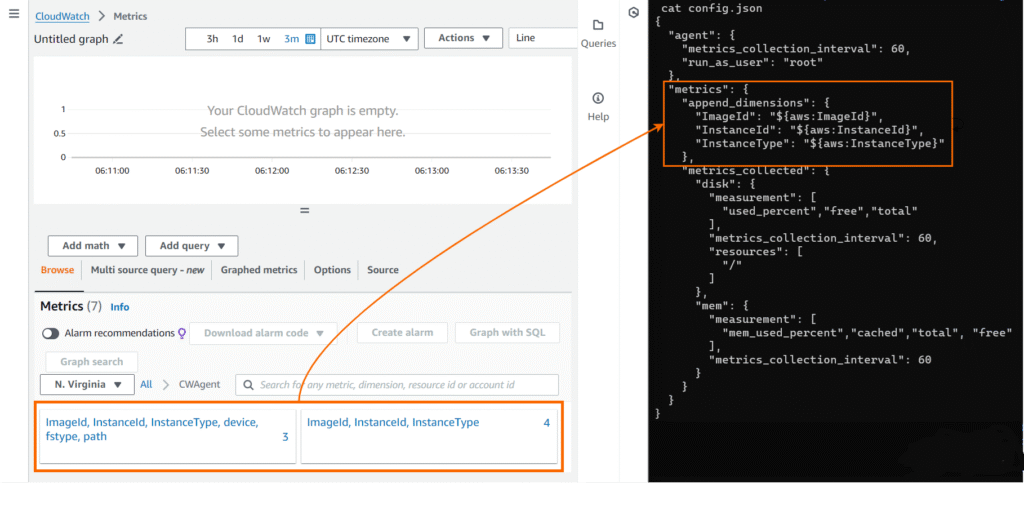
append_dimensions:
These are the default dimensions that are assigned to all collected metrics. They include:
ImageId:
The ID of the Amazon Machine Image (AMI) used to launch the instance.
InstanceId:
The ID of the instance.
InstanceType:
The type of the instance.
metrics_collected:
This is where you specify the metricsthat you want to collect. You’re collecting disk and memorymetrics:
disk:
This collects metrics about disk usage. The metricsinclude:
used_percent: The percentage of disk space used.
free: The amount of free disk space.
total: The total amount of disk space.
metrics_collection_interval:
The frequency at which the disk metrics are collected. It’s set to 60 seconds.
resources:
The file paths that the disk metrics arecollected from. It’s set to “/”, which represents the rootdirectory.
mem:
This collects metrics about memory usage.
The metricsinclude:
mem_used_percent: The percentage of memory used.
Notes on Config
metrics_collection_interval: Metrics are gathered every 60 seconds.run_as_user: Runs asroot.append_dimensions: Adds metadata (AMI ID, instance ID/type).- You can expand metrics (e.g., CPU, network, swap) by editing the config file.